Conversion Rate by Industry
Search ad conversion rates by industry range from 2.64% in Finance & Insurance to 16.2% in Animals & Pets, with the median category at 7.32%. Landing pages convert lower, at a 3.70% median across 10 industries, partly because they count every visitor from every source, not just people who clicked an ad.
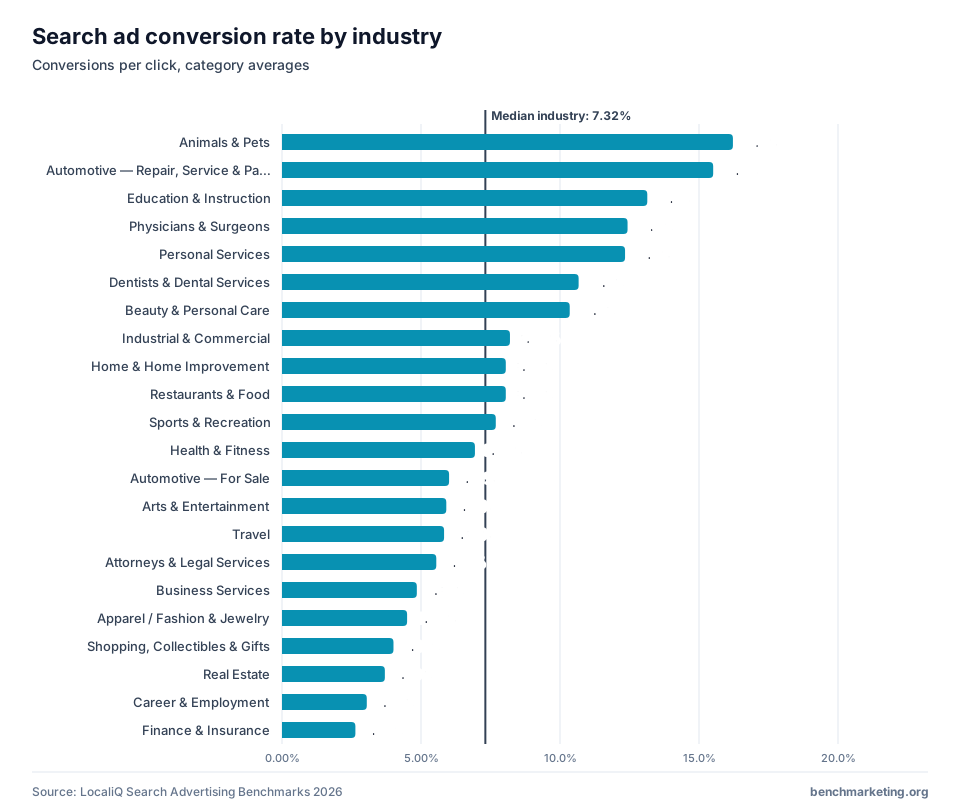
Search ad conversion rate by industry
Conversions per ad click in Google and Microsoft search campaigns, highest first.
| Industry category | Conversion rate |
|---|---|
| Animals & Pets | 16.2% |
| Automotive — Repair, Service & Parts | 15.5% |
| Education & Instruction | 13.1% |
| Physicians & Surgeons | 12.4% |
| Personal Services | 12.3% |
| Dentists & Dental Services | 10.7% |
| Beauty & Personal Care | 10.3% |
| Industrial & Commercial | 8.20% |
| Home & Home Improvement | 8.05% |
| Restaurants & Food | 8.05% |
| Sports & Recreation | 7.69% |
| Health & Fitness | 6.94% |
| Automotive — For Sale | 6.01% |
| Arts & Entertainment | 5.91% |
| Travel | 5.83% |
| Attorneys & Legal Services | 5.55% |
| Business Services | 4.85% |
| Apparel / Fashion & Jewelry | 4.50% |
| Shopping, Collectibles & Gifts | 4.01% |
| Real Estate | 3.70% |
| Career & Employment | 3.05% |
| Finance & Insurance | 2.64% |
Landing page conversion rate by industry
Medians and quartiles from the curated cohort, Q1 2023 – Q4 2024, with the search ad rate for the matching category where one is published.
| Industry | Landing page median | Middle half (P25–P75) | Search ad rate |
|---|---|---|---|
| Financial Services | 5.01% | 2.6%–8.5% | 2.64% |
| Legal | 4.90% | 2.5%–8.3% | 5.55% |
| Home Services | 4.10% | 2.1%–6.9% | 8.05% |
| Healthcare | 3.80% | 1.9%–6.4% | 12.4% |
| Insurance | 3.80% | 1.9%–6.4% | 2.64% |
| Dental | 3.60% | 1.8%–6.0% | 10.7% |
| Education | 3.40% | 1.7%–5.8% | 13.1% |
| SaaS | 3.00% | 1.5%–5.1% | — |
| Ecommerce | 2.60% | 1.3%–4.4% | — |
| Real Estate | 2.40% | 1.2%–4.1% | 3.70% |
What these benchmarks mean
Which industries convert best
Animals & Pets (16.2%), Automotive — Repair, Service & Parts (15.5%), Education & Instruction (13.1%) lead the search data, converting 1.8 to 2.2 times the median category. If your industry sits near the top of this table, a rate near its average is the realistic target, not the median across industries.
Which industries convert least
Finance & Insurance (2.64%), Career & Employment (3.05%), Real Estate (3.70%) sit at the bottom. These are typically researched over weeks, not booked on the spot, so judge these campaigns on cost per lead and lead quality as well as rate.
Do not compare search and landing-page rates directly
A search ad conversion rate counts conversions per ad click. A landing page conversion rate counts conversions per visitor from every traffic source. The two measure different things, so benchmark each against its own table.
Methodology and sources
LocaliQ Search Advertising Benchmarks 2026
- Statistic: Category averages as published by the source. The source does not publish medians or percentiles, so quartiles on this page are computed across the 22 category averages, not across advertisers.
- Period: 2026 edition, covering the period stated by the source
- Sample: Not published as a single count; the source describes thousands of LocaliQ advertisers
- Geography: Not broken out by the source
- Basis: Google Ads and Microsoft Ads search campaigns across thousands of LocaliQ advertisers. Cost per lead is the source's figure for cost per conversion, where the conversion is a lead.
Benchmarketing curated benchmark cohort
- Statistic: Medians with 25th and 75th percentiles
- Period: Q1 2023 – Q4 2024
- Sample: Multi-source cohort; published sample sizes vary by source and are not combined into one count
- Geography: Not broken out by source
- Basis: Compiled from WordStream Google Ads Benchmarks, Meta Business Insights, HubSpot Email Marketing Report, Unbounce Conversion Benchmark Report, Databox Marketing Benchmark Report.
Common questions
What is the average conversion rate by industry?
For search ads the median category converts 7.32% of clicks. For landing pages the median industry converts 3.70% of visitors.
Which industry has the highest conversion rate?
Animals & Pets has the highest search ad conversion rate in the data at 16.2%. Among landing pages, Financial Services leads at 5.01%.
What is a good conversion rate for my industry?
Beating your industry's average is a sound first target. For landing pages, the 75th percentile in the second table marks the top quarter.
Why is the landing page conversion rate lower than the search ad rate?
Landing page rates include visitors from every source, many of whom are browsing rather than ready to act. Search ad clicks come from people who just searched for what you sell.