Cost Per Lead by Industry
The average cost per lead from search ads ranges from $26.84 in Arts & Entertainment to $131.63 in Attorneys & Legal Services, with the median industry at $60.98. Channel changes the answer too: LinkedIn leads cost more than search leads in 2 of the 5 industries both sources cover and less in 3, so compare a lead's cost only with the same channel and industry.
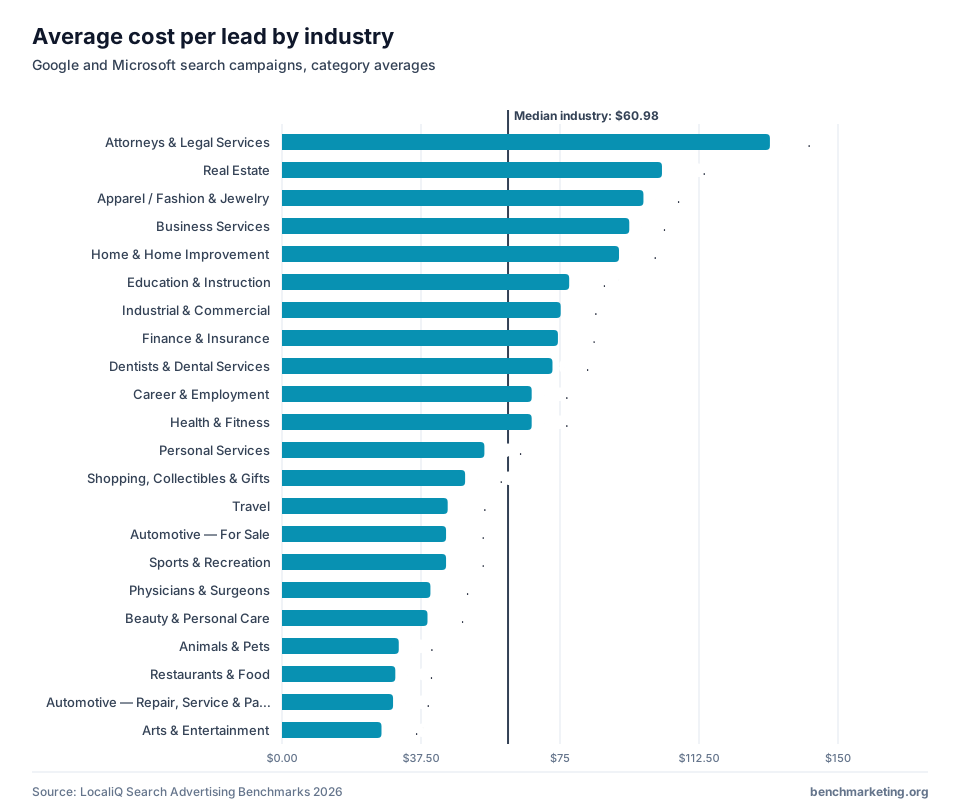
Search ad cost per lead by industry
Category averages, highest first.
| Industry category | Cost per lead | Against the median industry |
|---|---|---|
| Attorneys & Legal Services | $131.63 | +116% |
| Real Estate | $102.51 | +68% |
| Apparel / Fashion & Jewelry | $97.51 | +60% |
| Business Services | $93.69 | +54% |
| Home & Home Improvement | $90.92 | +49% |
| Education & Instruction | $77.48 | +27% |
| Industrial & Commercial | $75.19 | +23% |
| Finance & Insurance | $74.44 | +22% |
| Dentists & Dental Services | $72.97 | +20% |
| Career & Employment | $67.36 | +10% |
| Health & Fitness | $67.36 | +10% |
| Personal Services | $54.60 | −10% |
| Shopping, Collectibles & Gifts | $49.40 | −19% |
| Travel | $44.70 | −27% |
| Automotive — For Sale | $44.26 | −27% |
| Sports & Recreation | $44.26 | −27% |
| Physicians & Surgeons | $40.04 | −34% |
| Beauty & Personal Care | $39.25 | −36% |
| Animals & Pets | $31.50 | −48% |
| Restaurants & Food | $30.57 | −50% |
| Automotive — Repair, Service & Parts | $29.96 | −51% |
| Arts & Entertainment | $26.84 | −56% |
LinkedIn Ads cost per lead by industry
Medians and quartiles from the curated cohort, Q1 2023 – Q4 2024.
| Industry | Median CPL | Middle half (P25–P75) |
|---|---|---|
| Legal | $95.80 | $54–$162 |
| Financial Services | $88.20 | $49–$148 |
| B2B Services | $72.60 | $40–$122 |
| Healthcare | $64.10 | $36–$108 |
| SaaS | $58.40 | $32–$98 |
| Education | $51.30 | $28–$86 |
What these benchmarks mean
Where leads cost the most and the least
Attorneys & Legal Services ($131.63), Real Estate ($102.51), Apparel / Fashion & Jewelry ($97.51) have the costliest leads; Arts & Entertainment ($26.84), Automotive — Repair, Service & Parts ($29.96), Restaurants & Food ($30.57) the cheapest. A high CPL is not a problem in itself where one customer is worth a lot, so judge yours against customer value as well as the industry row.
LinkedIn is not always the expensive channel
Of the 5 industries both sources cover, LinkedIn leads cost more in 2 and less in 3. Dearer on LinkedIn: Financial Services ($88.20 on LinkedIn, $74.44 on search), Healthcare ($64.10 on LinkedIn, $40.04 on search). Cheaper on LinkedIn: Legal ($95.80 on LinkedIn, $131.63 on search), B2B Services ($72.60 on LinkedIn, $93.69 on search), Education ($51.30 on LinkedIn, $77.48 on search). The sources cover different periods and one reports medians while the other reports averages, so read the gap as direction, not an exact difference.
Use the median, then segment
The median industry pays $60.98. Use your own industry's row as the baseline, and segment further by lead type: a demo request and a newsletter signup should never share a target.
Methodology and sources
LocaliQ Search Advertising Benchmarks 2026
- Statistic: Category averages as published by the source. The source does not publish medians or percentiles, so quartiles on this page are computed across the 22 category averages, not across advertisers.
- Period: 2026 edition, covering the period stated by the source
- Sample: Not published as a single count; the source describes thousands of LocaliQ advertisers
- Geography: Not broken out by the source
- Basis: Google Ads and Microsoft Ads search campaigns across thousands of LocaliQ advertisers. Cost per lead is the source's figure for cost per conversion, where the conversion is a lead.
Benchmarketing curated benchmark cohort
- Statistic: Medians with 25th and 75th percentiles
- Period: Q1 2023 – Q4 2024
- Sample: Multi-source cohort; published sample sizes vary by source and are not combined into one count
- Geography: Not broken out by source
- Basis: Compiled from WordStream Google Ads Benchmarks, Meta Business Insights, HubSpot Email Marketing Report, Unbounce Conversion Benchmark Report, Databox Marketing Benchmark Report.
Common questions
What is the average cost per lead by industry?
From search ads, the median industry averages $60.98 per lead. The full range is $26.84 (Arts & Entertainment) to $131.63 (Attorneys & Legal Services).
Which industry has the highest cost per lead?
Attorneys & Legal Services has the highest search ad cost per lead in the data at $131.63, followed by Real Estate ($102.51).
Is LinkedIn cost per lead higher than Google Ads?
Not always. Of the 5 industries both sources cover, LinkedIn leads cost more in 2 and less in 3. Dearer on LinkedIn: Financial Services ($88.20 on LinkedIn, $74.44 on search), Healthcare ($64.10 on LinkedIn, $40.04 on search). Cheaper on LinkedIn: Legal ($95.80 on LinkedIn, $131.63 on search), B2B Services ($72.60 on LinkedIn, $93.69 on search), Education ($51.30 on LinkedIn, $77.48 on search). The sources cover different periods and one reports medians while the other reports averages, so read the gap as direction, not an exact difference. Across all industries, LinkedIn's median is $75.00 and the median search category averages $60.98.
What is a good cost per lead for my industry?
Below your industry's average is a reasonable first target. Whether a CPL is good depends on how many leads become customers and what each customer is worth.