Google Ads Benchmarks 2026
See average Google Ads benchmarks for CTR, CPA, CPC, and conversion rate across 14 industries. Find your industry median and compare.
Google Ads performance overview
| Metric | Median | 25th percentile | 75th percentile | Elite |
|---|---|---|---|---|
| CTR (click-through rate) | 6.11% | 3.2% | 9.8% | 12%+ |
| CPC (cost per click) | $4.22 | $2.10 | $7.50 | <$1.50 |
| CVR (conversion rate) | 7.04% | 3.5% | 11.2% | 15%+ |
| CPA (cost per acquisition) | $53.52 | $28 | $95 | <$20 |
| CPM (cost per 1,000 impressions) | $38.40 | $22 | $58 | <$18 |
| ROAS (return on ad spend) | 2.87x | 1.8x | 4.2x | 6x+ |
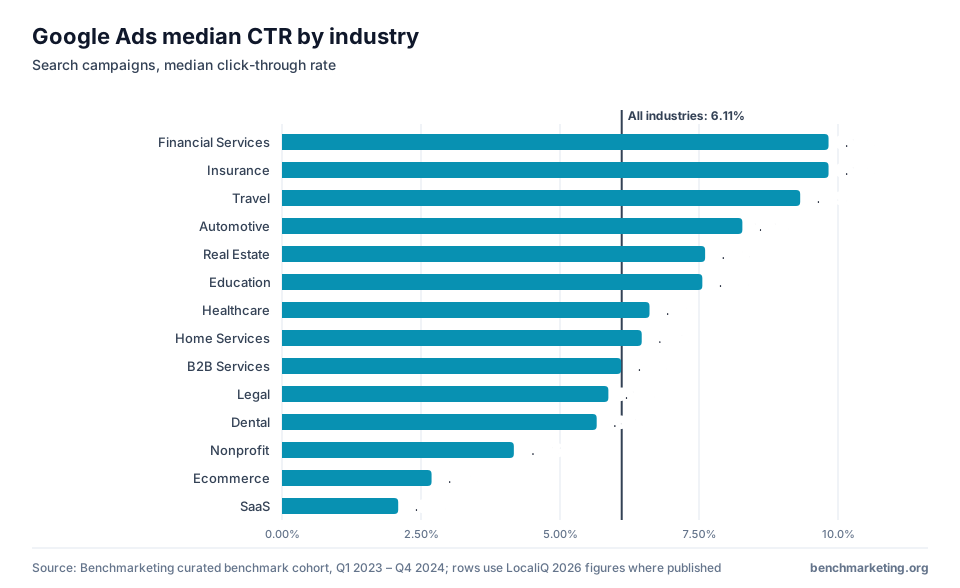
CTR (click-through rate) by industry
| Industry | Median | 25th percentile | 75th percentile |
|---|---|---|---|
| Home Services | 6.47% | 4.23% | 9.83% |
| Travel | 9.32% | 6.17% | 14.34% |
| Automotive | 8.28% | 5.17% | 12.63% |
| Legal | 5.87% | 3.67% | 9.17% |
| Education | 7.56% | 4.43% | 12.25% |
| Real Estate | 7.61% | 4.51% | 12.10% |
| Financial Services | 9.83% | 5.74% | 16.21% |
| Healthcare | 6.61% | 3.84% | 10.51% |
| Ecommerce | 2.69% | 1.5% | 4.4% |
| SaaS | 2.09% | 1.1% | 3.5% |
| B2B Services | 6.10% | 3.29% | 9.87% |
| Nonprofit | 4.17% | 2.7% | 6.4% |
| Insurance | 9.83% | 5.67% | 15.44% |
| Dental | 5.66% | 3.38% | 8.84% |
CPA (cost per acquisition) by industry
| Industry | Median | 25th percentile | 75th percentile |
|---|---|---|---|
| Automotive | $44.26 | $22.21 | $78.75 |
| Ecommerce | $45.27 | $25 | $82 |
| Home Services | $90.92 | $52.33 | $144.60 |
| Legal | $131.63 | $75.01 | $223.25 |
| Healthcare | $40.04 | $23.07 | $66.66 |
| Education | $77.48 | $42.63 | $125.76 |
| Financial Services | $74.44 | $43.61 | $125.38 |
| Real Estate | $102.51 | $57.14 | $171.42 |
| SaaS | $137.21 | $78 | $225 |
| B2B Services | $93.69 | $51.86 | $157.30 |
| Nonprofit | $31.22 | $16 | $55 |
| Insurance | $74.44 | $41.85 | $128.55 |
| Dental | $72.97 | $40.54 | $122.68 |
CVR (conversion rate) by industry
| Industry | Median | 25th percentile | 75th percentile |
|---|---|---|---|
| Home Services | 8.05% | 4.24% | 12.91% |
| Legal | 5.55% | 2.86% | 9.14% |
| Automotive | 6.01% | 3.09% | 9.77% |
| Financial Services | 2.64% | 1.35% | 4.35% |
| Education | 13.14% | 6.59% | 21.71% |
| Healthcare | 12.43% | 6.29% | 20.35% |
| SaaS | 2.92% | 1.4% | 4.9% |
| Ecommerce | 2.81% | 1.4% | 4.7% |
| Real Estate | 3.70% | 1.80% | 6.14% |
| B2B Services | 4.85% | 2.39% | 8.14% |
| Nonprofit | 4.41% | 2.2% | 7.2% |
| Insurance | 2.64% | 1.35% | 4.22% |
| Dental | 10.67% | 5.50% | 16.87% |
CPC (cost per click) by industry
| Industry | Median | 25th percentile | 75th percentile |
|---|---|---|---|
| Legal | $9.87 | $5.92 | $16.85 |
| Financial Services | $3.39 | $1.94 | $5.83 |
| SaaS | $6.40 | $3.80 | $10.90 |
| B2B Services | $5.87 | $3.37 | $9.70 |
| Real Estate | $3.22 | $1.80 | $5.36 |
| Healthcare | $4.76 | $2.69 | $7.98 |
| Education | $4.81 | $2.64 | $8.02 |
| Home Services | $8.33 | $4.52 | $13.76 |
| Automotive | $2.27 | $1.30 | $3.83 |
| Ecommerce | $1.16 | $0.60 | $2.10 |
| Nonprofit | $2.11 | $1.10 | $3.80 |
| Insurance | $3.39 | $2.04 | $5.72 |
| Dental | $8.00 | $4.50 | $13.50 |
How Benchmarketing reads Google Ads benchmarks
The Benchmarketing 4-Band Method. The Benchmarketing 4-Band Method reads every marketing metric against four percentile bands — P25 (bottom quartile), median, P75 (top quartile), and elite (top ~10%) — for a specific industry and channel, instead of a single cross-industry average. Averages blend brand and non-brand campaigns, $500/month and $500,000/month accounts, and unrelated industries into a number almost nobody actually has.
Where the numbers come from. The figures on this page come from the Benchmarketing benchmark dataset — thousands of curated benchmark observations across channels, industries, and US metro areas. Every statistic traces to a named source: WordStream Google Ads Benchmarks (2024), Meta Business Insights (2024), HubSpot Email Marketing Report (2024), Unbounce Conversion Benchmark Report (2024), Databox Marketing Benchmark Report (2024), AdLiftr Snapchat Ads Cost Benchmarks (2026), Ad Badger Amazon Advertising Benchmarks (2026). Benchmarketing does not publish anonymous "studies show" figures.
The Benchmarketing position. Beating the cross-industry average for Google Ads is a vanity milestone, not a target. Compare your number to the P25–P75 band for your specific industry and channel; if you are above average but below your industry's P75, you are leaving performance on the table.
Frequently asked questions
What are good Google Ads benchmarks for my industry?
Google Ads performance varies significantly by industry. The key metrics to benchmark are CTR, CPC, conversion rate, and CPA. For example, Home Services typically sees CTR of 4.28% while SaaS sees 2.09%. Use the industry breakdown tables on this page to find your specific benchmarks.
How often are Google Ads benchmarks updated?
Benchmarketing reviews benchmark interpretations quarterly and refreshes numeric cohorts when newer source coverage is sufficiently comparable. This cohort was editorially reviewed in March 2026 and its observations cover Q1 2023 – Q4 2024, so use it as directional planning context rather than a live market quote.
Should I compare my Google Ads to the median or the top quartile?
Use the median as your baseline - it tells you where most advertisers in your industry sit. Use the P75 (top 25%) as your performance target. The elite threshold represents the top 10% and is achievable with advanced optimization, mature accounts, and strong creative.
What is a good Quality Score for Google Ads?
A Quality Score of 7/10 or above is generally considered good. Scores of 8–10 indicate that your ad relevance, expected CTR, and landing page experience are all strong. Quality Score directly impacts your Ad Rank and effective CPC.
How do I improve my Google Ads performance?
The most impactful improvements come from: (1) tightening keyword match types to improve relevance, (2) writing tighter, benefit-focused ad copy, (3) optimizing landing pages for speed and message match, (4) using Smart Bidding with sufficient conversion data, (5) leveraging all applicable ad extensions.